Sponsors expect research sites to enroll. Sites, increasingly, are expected to bring some of that enrollment themselves rather than wait for a central recruitment vendor. And yet most research site websites are built on borrowed logic: the design patterns, the metrics and the vendor pitches all come from hospital digital patient experience, where the problem …


Sponsors expect research sites to enroll. Sites, increasingly, are expected to bring some of that enrollment themselves rather than wait for a central recruitment vendor. And yet most research site websites are built on borrowed logic: the design patterns, the metrics and the vendor pitches all come from hospital digital patient experience, where the problem was solved for a completely different person.
The mismatch is not cosmetic. A hospital optimizes for a patient who is already registered, already insured, already coming back. A research site is trying to convince a stranger, in a single session, to volunteer for something with medical risk and no promised benefit. Those are not the same funnel, and they do not respond to the same fixes.
Original research in this article
In September 2026 we measured two things. First, every US site record on industry-sponsored trials recruiting on ClinicalTrials.gov: 4,917 studies, 60,032 site records. Second, the websites of a random sample of 84 named independent US research sites drawn from that registry, coded across findability, readability, privacy and contact.
Headline results: 13.4 percent of US site records carry no identifiable site name. 28.6 percent of the research sites we sampled publish no working list of the studies they are enrolling. One website in 84 uses structured data to describe a study.
Method, limits and raw coding: Trialsfocus Site Website Scan, V1, 2 September 2026.

What does hospital digital patient experience actually solve?
Give the hospital model its due. It works, and it works because it inherited a relationship.
Hospital DPX is built around retention and administration: portal adoption, online scheduling, bill pay, prescription refills, secure messaging, post-discharge follow-up. Every one of those assumes a patient who has a record in the system, a reason to return, and an insurer paying for it. The digital layer removes friction from a relationship that already exists.
That is a real problem, and the industry has spent fifteen years and a great deal of money solving it. It just isn’t your problem.
Who is the person landing on a research site’s website?
The difference is easiest to see side by side.
| Hospital patient | Research site visitor | |
|---|---|---|
| Relationship | Registered, has a record | Anonymous stranger |
| Motivation | Needs care, already decided | Curious, possibly desperate, unconvinced |
| Number of decisions | Ongoing, many small ones | One decision, made once |
| Perceived risk | Low, routine | High, medical, unfamiliar |
| Who pays | Patient or insurer | Nobody; participation is free and voluntary |
| Loyalty | Built over years | Zero |
| What success looks like | Portal login, appointment kept | A hand raised by someone who never came back to the page |
| Cost of failure | A rescheduled visit | An unenrolled participant, invisible forever |
That last row is the one that matters. A hospital knows when its digital experience fails, because the patient calls. A research site never finds out. The person who couldn’t understand the eligibility criteria closes the tab and is never counted, and the site concludes that “there weren’t many eligible patients in the area.”
What are the five stages of the research site patient journey?
Digital patient experience for a research site breaks into five distinct stages. Four of them are recognizable from other industries. The fifth is where research sites are uniquely exposed.
Stage 1: Can the study be found at all?
Findability is not a marginal channel. In CISCRP’s 2025 Perceptions and Insights study, 22 percent of past participants first learned about their study online. That is roughly one in five participants whose entire journey began with a search box.
The common assumption is that ClinicalTrials.gov handles this. It does not. In one cross-sectional analysis, three trained clinical trials navigators curated searches for 18 cancer patients: of 247 eligible trials, 140 (57 percent) were listed on ClinicalTrials.gov but were only actually surfaced through alternative websites, not through the initial registry searches. Trained navigators, with time and expertise, missed more than half. A patient with a diagnosis and a phone will do considerably worse.
What the registry actually tells a patient
We measured this rather than asserting it. On 2 September 2026 we retrieved every interventional study with an industry lead sponsor recruiting at a US location: 4,917 studies containing 60,032 US site records across 26,874 distinct facility names. The median study lists five US sites.
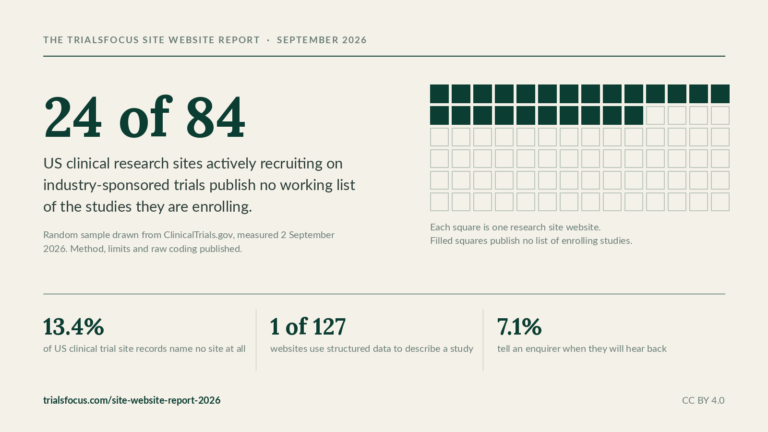
8,025 of those 60,032 US site records (13.4 percent) carry no identifiable site name. They read “Research Site”, “Clinical Study Site”, “GSK Investigational Site”, “Local Institution”, “Site 0123”. A city, a state, and nothing else.
440 of the 4,788 studies recruiting in the US (9.2 percent) are anonymised at every single one of their US locations. For those studies a patient can learn that a trial exists somewhere in their state and cannot learn who is running it, what it is called, or how to reach anyone. There is no number to call because there is no name to call.
This is not a criticism of the registry, which was built as a compliance record and not as a directory. It is the evidence for the structural point: for roughly one study in ten, the site’s own website is not a nice-to-have, it is the only route a patient has.
And then we looked at the websites
So we drew a random sample from the registry: 3,310 named independent US research sites recruiting on industry-sponsored trials, from which 127 organisations were selected by seeded shuffle, and their websites scanned.
Ten of the 127 (7.9 percent) had no working website at all. Not a weak website. None. A domain sitting on a for-sale parking page, an “under construction” placeholder, a homepage serving the web server’s default welcome screen, or simply nothing beyond a third-party directory listing.
Of the 84 dedicated research sites that did have a working website, 24 (28.6 percent) publish no working list of the studies they are currently enrolling. The failure modes repeat: a “Current Studies” page containing only a contact form; a study widget stuck on “Loading”; a therapeutic-area list with nothing behind it; “Learn More” links that are dead anchors; a page holding two PDF viewers; and one site still carrying its hosting provider’s unedited template copy where the studies should be.
Of the 56 sites that do publish a real list, seven render it only in JavaScript, so it is absent from the HTML a crawler receives.
The structural conclusion holds and now has a number attached. A website is not publishing studies, it is building addresses that studies pass through. A page tied to a protocol dies with the protocol. A page tied to a condition and a place accumulates value across every protocol that ever runs there. Thirty-seven of 84 sites (44 percent) give an individual study its own URL. For the other 56 percent there is no address: nothing for a search engine to rank, nothing for an answer engine to cite, nothing for a patient to send to their doctor.
The most striking single result is the smallest. Across all 127 websites scanned, exactly one uses MedicalTrial or MedicalStudy structured data, and four link a ClinicalTrials.gov NCT identifier. Structured data on these sites is otherwise generic CMS output: WebPage, Organization, BreadcrumbList. The vocabulary for describing a clinical trial to a machine has existed for years and is, in this sample, unused.
Source: Trialsfocus Registry Analysis and Site Website Scan, 2 September 2026. Method and raw coding.

Stage 2: Can it be understood?
This is where the largest single gap in the entire journey sits, and it is measurable.
An assessment of clinical trial recruitment resources found a mean readability of grade 11.7, with web-based materials significantly harder to read than print materials. Only 30 percent of those resources contained an explicit call to action. Separately, a readability assessment of eligibility criteria found that a college reading level is required to understand the text, largely because of technical jargon.
Now put the audience next to it. In the US national assessment of adult literacy, 12 percent of adults have proficient health literacy, 53 percent intermediate, 22 percent basic and 14 percent below basic.
Twelve percent proficient, on one side. College-level eligibility criteria, on the other. That is the gap, and no amount of chatbot, portal or “engagement platform” spend closes it. It is closed by rewriting the words.
We then measured the same thing on the sites themselves, and found a prior problem. Only 38 of 84 sites (45.2 percent) publish eligibility criteria for any individual study at all. Before readability becomes a question, the text has to exist, and for more than half of these sites it does not. A patient cannot self-select. They can only phone and ask, which is precisely the coordinator time the website was supposed to protect.
Where the text does exist, we scored it. Median Flesch-Kincaid grade 9.4 across 40 scorable texts, with 26 of 40 (65 percent) above grade 8 and 10 of 40 (25 percent) above grade 12. The hardest measured grade 21.8.
The range is the useful part: 2.3 to 21.8, on the same kind of page, for the same kind of study. Sites that write plainly exist inside this sample. Most simply paste the protocol.
Stage 3: Can the site be trusted?
A visitor arrives with three unspoken questions: who runs this, is it real, and what happens to what I tell you.
Privacy is the sharpest and least-discussed part of this. Analysis of 3,747 US non-federal acute care hospital websites found that 98.6 percent transferred data to third parties from the homepage, with a median of 16 transfers per homepage, and 94.3 percent set at least one third-party cookie. Alphabet received data from 98.5 percent of those homepages; Meta from 55.6 percent.
That is hospital data. The equivalent had not been measured on clinical research site websites, so we measured it.
On 83 research site homepages, loaded with a clean profile and no consent given, 25 (30.1 percent) carry a third-party advertising or social pixel. The Meta pixel alone is on 21 (25.3 percent). Add session-recording tools such as Microsoft Clarity and Hotjar and the figure is 28 of 83 (33.7 percent).
Nineteen of 83 sites (22.9 percent) present any consent mechanism at all. Fifteen sites carry an advertising pixel with no consent mechanism of any kind. Where a mechanism does exist it frequently gates nothing: we observed Meta, Bing, HubSpot advertising and Clarity pixels firing while a cookie banner sat unanswered on screen, and one site loaded a consent platform that never rendered a banner at all. In the whole sample, one site was observed actually holding its tags until a choice was made.
Thirty of 84 sites (35.7 percent) have no reachable privacy policy. Nine sites carry an advertising pixel and ask for health information on a form. Three of those nine also have no privacy policy anywhere. One site is served over plain HTTP, with no privacy policy, and collects a 51-field questionnaire including date of birth, ethnicity and medical conditions.
These proportions are well below the 98.6 percent found on hospital homepages, and that is not the comfort it appears to be. Hospitals are large institutions with compliance functions and legal exposure that has already been litigated. A quarter of independent research sites running a Meta pixel with no consent layer, on pages built to collect health information from strangers, is the same category of risk carried by organisations far less equipped to notice it. A tracking pixel on a condition-specific page, firing before consent, is a different kind of problem when the condition is HIV or depression and the page is a recruitment funnel.
Trust in this context is not a badge in the footer. It is a specific privacy policy, consent language on the form itself, and no advertising pixel on a page where somebody is about to type their diagnosis.
Source: Trialsfocus Site Website Scan, 2 September 2026. Method and raw coding.
Stage 4: Can contact be made?
The form is where everything upstream is either converted or discarded. Long forms, unlabeled fields, error messages that say “invalid input,” touch targets too small for older hands, no visible focus indicator, no phone number for the person who would rather call.
Study populations skew older. Accessibility here is not a legal checkbox that a widget solves; it is enrollment infrastructure. A form that a 68-year-old cannot complete on a phone is a form that filters out exactly the population the protocol needs.
Measured across the same 84 sites: nine (10.7 percent) have no contact or pre-screening form anywhere on the website. Of the 64 forms whose fields could be inspected, 28 contain at least one field with no programmatic label, which is the difference between a form a screen reader can complete and one it cannot.
The median form asks for 8 fields. The largest asks for 268, presenting a checklist of more than 250 conditions. Twenty sites (23.8 percent) show no phone number, which removes the fallback for exactly the patient least likely to finish a form on a phone.

Stage 5: What happens in the silence after the form is submitted?
Most digital patient experience writing stops at Stage 4. This is the stage that separates a research site from a hospital, and the received wisdom about it is wrong.
The industry line is that speed is everything: respond within an hour or lose the patient. It gets repeated because it sounds right, not because it was measured. The one dataset we could find on inquiry latency was published by a recruitment vendor and is no longer publicly available, so we do not rely on it.
So the problem is not latency. The problem is that nobody owns the gap. No regulation obliges a site to respond to an inbound web inquiry within any particular window. Central recruitment vendors have SLAs; a site’s own website usually has nothing. The result is not a site that responds in six hours instead of one. It is a site that responds in three weeks, or never, and never learns which.
This is measurable too, and the measurement is stark. Six of 84 sites (7.1 percent) tell an enquirer when to expect a response. Ninety-three percent ask a stranger for health information and say nothing at all about what happens next.
That is the gap, quantified. Not a slow response. An unowned one.
The fix is unglamorous and entirely operational: an automatic acknowledgment that states what happens next and when, a named owner for the inbound queue, and a measured time-to-first-contact. That is a digital patient experience metric that would actually change an enrollment number.
Which metrics are being measured, and which ones matter?
If the hospital frame is inherited, so are the metrics. This is the substitution to make:
| Inherited from hospital DPX | What a research site should measure instead |
|---|---|
| Portal adoption rate | Study page organic entries by condition and city |
| Online self-scheduling rate | Pre-screen form start rate, and start-to-completion rate |
| Bill pay completion | Reading grade level of eligibility criteria text |
| Secure message volume | Time to first human contact after form submission |
| Patient satisfaction score | Mobile completion rate versus desktop, on the same form |
| Appointment no-show rate | Inquiry-to-screening-visit conversion |
| App downloads | Third-party requests firing before consent on health-information pages |
| Average session duration | Percentage of currently enrolling studies with a crawlable, indexable page |
The left column describes a relationship being maintained. The right column describes a decision being made once, by a stranger, under uncertainty. Only one of them is your business.

Does being bigger help?
It does not, and this was the result we least expected.
Alongside the random sample of 84 independent sites, we scanned a separate, deliberately chosen cohort of 27 well-known US site networks and SMOs: the organisations with marketing departments, recruitment budgets and industry visibility. They were expected to score better.
| Measure | Random sample (n=84) | Established organisations (n=27) |
|---|---|---|
| No working list of enrolling studies | 28.6% | 9 of 27 |
| Studies have their own URL | 44.0% | 8 of 27 |
MedicalTrial structured data | 1 of 84 | 0 of 27 |
| Links an NCT identifier | 4.8% | 1 of 27 |
| Publishes per-study eligibility text | 45.2% | 7 of 27 |
| Carries an advertising pixel | 30.1% | 9 of 27 |
| States a response time | 7.1% | 1 of 27 |
Two things stand out. Structured data is absent everywhere. Across all 127 websites in the study, one uses study markup. Scale, funding and industry standing change nothing about it.
And the better-resourced cohort tracks more, not less. The heaviest tracking in the entire study sits in this cohort, including one site firing five advertising pixels before any consent. The tracking is heaviest precisely where recruitment marketing is most professionalised, which is to say precisely where the health-information risk is largest.
What does a complete research site website look like?
The five stages describe the problem. Turning them into a specification is a separate exercise, and we have published ours.
The Trialsfocus Benchmark is a 70-item standard across eight groups, drawn from FDA and OHRP guidance, CISCRP research, WCAG 2.2, Google’s Core Web Vitals thresholds and schema.org health vocabulary. Four of its groups map directly onto the stages above: Search (Stage 1), Patients (Stage 2), Trust (Stage 3) and Accessibility (Stage 4). The remaining groups cover what sponsors and CROs check during remote feasibility review, which is the second audience every research site website is quietly being judged by.
A standard is not a study, so we ran the study. The Site Website Scan measures a random sample of US research site websites against the questions this article raises. Its full findings, its limits and its raw coding are published, including the seed used to draw the sample, so that anyone can repeat it.
Those limits are worth stating here rather than burying. The primary cohort is 84 websites, not a census. It is a single day’s snapshot. Most measures were coded once, and an independent re-coding of a random subset agreed on the advertising-pixel measure in 10 cases out of 10 but on the studies-list measure in 8 out of 10, so 28.6 percent should be read as approximately, not exactly. Our tracker-detection method also had to be corrected mid-study, and the correction roughly doubled the privacy figures; that is documented in full on the methodology page rather than quietly fixed.
No individual site is named anywhere in the findings, and none will be.
So what is digital patient experience in clinical research?
Now the definition, and only now.
Digital patient experience for a clinical research site is the sum of everything that happens between a stranger’s first search and their first conversation with a human being at the site: whether the study can be found, whether the eligibility criteria can be read, whether the organization can be trusted with health information, whether the form can be completed on a phone, and whether the silence after submission is owned by someone.
Five things, all measurable, none of them requiring a portal.
The reason to insist on this definition rather than the generic one is not semantic tidiness. It is that the generic definition sends sites shopping for software, and the measurements above show what the actual gaps are. Not an absent chatbot. A study list that does not exist on 28.6 percent of sites, eligibility criteria that do not exist on 54.8 percent, a Meta pixel with no consent layer on a quarter of them, and a response time stated by seven percent.
None of those is a technology problem. All of them are decisions.
Next in this series: pre-screening form design for research sites; rewriting eligibility criteria without losing accuracy; and the post-inquiry communication gap.
Sources
- CISCRP, Perceptions and Insights Study, 2025 (22 percent of past participants first learned about their study online), cited in The Trialsfocus Benchmark
- How are we communicating about clinical trials? An assessment of the content and readability of recruitment resources — mean readability grade 11.7; 30 percent with an explicit call to action; web materials harder than print
- Initial Readability Assessment of Clinical Trial Eligibility Criteria — college reading level required due to technical jargon
- Cross sectional analysis of clinical trials search results for cancer patients using a navigator-assisted clinical trials search using five different search engines — 140 of 247 eligible trials (57 percent) surfaced only through alternative websites
- Widespread Third-Party Tracking On Hospital Websites Poses Privacy Risks For Patients And Legal Liability For Hospitals, Health Affairs — 3,747 hospital websites, 98.6 percent with third-party data transfers, median 16 per homepage
- US National Assessment of Adult Literacy, health literacy distribution: 12 percent proficient, 53 percent intermediate, 22 percent basic, 14 percent below basic
- Continuum Clinical, response-time and enrollment analysis (3-4 day callbacks enrolling at near-parity with same-day)
- Trialsfocus Registry Analysis, 2 September 2026 — 4,917 industry-sponsored studies recruiting at US locations; 60,032 US site records across 26,874 distinct facility names; 13.4 percent of records carry no identifiable site name; 9.2 percent of studies anonymised at every US location. Derived from the ClinicalTrials.gov API v2. Method
- Trialsfocus Site Website Scan, 2 September 2026 — random sample of 127 named independent US research sites, 84 in the primary cohort. 7.9 percent with no working website; 28.6 percent with no working list of enrolling studies; 45.2 percent publishing per-study eligibility text, median Flesch-Kincaid grade 9.4; 30.1 percent carrying a third-party advertising pixel with 22.9 percent presenting any consent mechanism; 7.1 percent stating a response time. Method, limits and raw coding
- The Trialsfocus Benchmark, V1, 2026 — 70 items across eight groups
- Sawhney et al., Journal of Clinical Medicine Research, 2014 — telephone contact before clinic attendance: 77.7 percent recruitment versus 45.0 percent for postal invitation alone (n=212, single centre)